

Weekly Market Commentary May 26, 2026
LPL Research explores opportunities in agriculture as supply risks and fertilizer constraints reshape commodity markets and support potential gains.

Last Edited by: LPL Research
Last Updated: May 26, 2026
Seeds of Opportunity: The Case for Agriculture Investments
Commodity market trends: Commodity markets have been on an impressive, and volatile, run so far this decade, with leadership oscillating between energy and precious metals. Not surprising, after commodities’ “Lost Decade” of the 2010s, given the asset class tends to move in long capital cycles.
Shift to Agriculture: LPL Research has written plenty on precious metals and energy and holds positive views on each. However, the focus this week is on a corner of the commodity complex that is just starting to break out and catch our attention — agriculture.
Supply constraints and geopolitics: Constraints in the supply of fertilizer inputs, and how it may impact the agricultural commodity market, are one of the many impacts that investors have been paying attention to since the Strait of Hormuz closed.
Historical analysis: In this week’s Weekly Market Commentary, LPL Research presents an overview of the agriculture market, including historical analysis of the prior two commodity cycles and the environments when agricultural commodity and equity performance have converged and diverged.
Agriculture Commodities: Then and Now
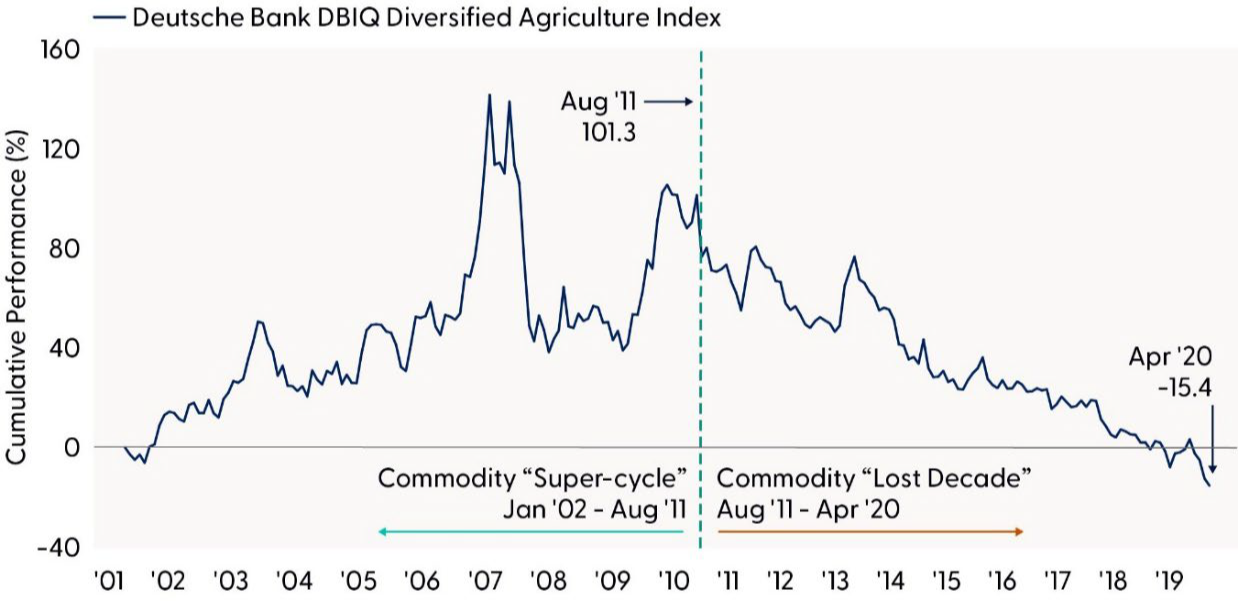
At the start of the 21st century (approximately 2002–2012), commodities broadly went through a massive investment cycle. Given the cycle drove run-ups in the price of most every commodity market, including both agricultural and non-agricultural commodities, this cycle is commonly referred to as a commodity “super-cycle.” This period was powered by increased demand for commodities broadly from emerging markets, primarily China’s rapid industrialization and urbanization at the time. Increased demand drove prices higher, as the supply impulse couldn’t respond quickly enough. However, in typical cyclical industry fashion, that supply response did eventually come, creating a “Lost Decade” (approximately 2012–2020) for commodity price performance. The incremental global supply that came to market coincided with several headwinds, creating a “double whammy” for commodity markets broadly. Those headwinds included: decelerating growth from China; a stronger dollar; lower energy costs from the U.S. shale boom; and waning institutional investor interest in commodity investments. Additional headwinds, specific to agriculture, include technological advances in farming and some of the best growing conditions seen in a century. The “Commodity ‘Super-Cycle’ and ‘Lost Decade’ Defined First Two Decades of 21st Century” chart illustrates cumulative returns for agricultural commodities during these periods.
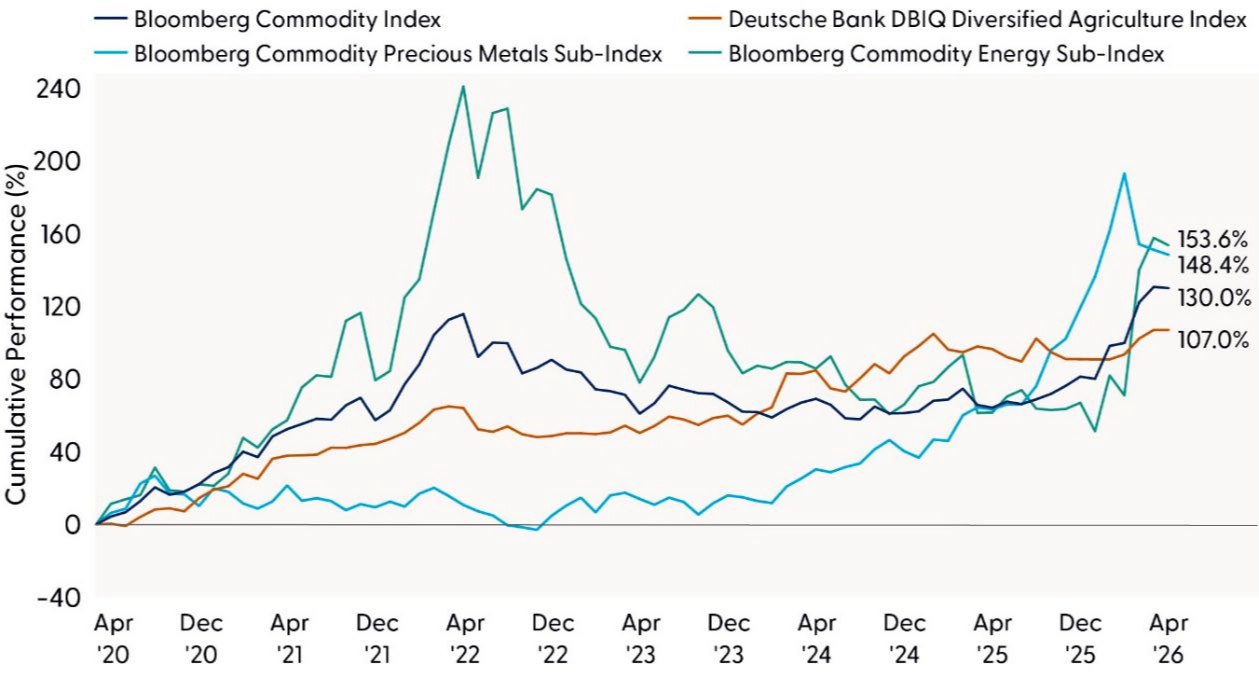
Agricultural (Ag) commodities typically do not receive the level of press coverage as energy or precious metals, and the performance of ag commodities has slightly lagged behind them. However, the post-COVID-19 performance has certainly been strong enough to declare that the “Lost Decade” for the commodity complex writ large is over. Cumulative performance of the three commodity segments, as well as a broad index of commodities, is illustrated in the “Commodity Markets Recover in the 2020s (April 2020–May 20, 2026)” chart.
Which brings us to 2026 and the Strait of Hormuz. The Iran war and subsequent closure of the Strait have impacted global trade flows in ways that investors are still trying to ascertain. One of the knock-on effects of the constrained waterway is the supply of various inputs for fertilizer; approximately 20–30% of global fertilizer exports transit the Strait in normal times, including meaningful shares of urea (~34%), ammonia (~23%), phosphates (~20%), and sulfur (~45%). Nitrogen and phosphate fertilizers are foundational inputs for grain production, therefore a sustained disruption raises the risk that farmers reduce application rates, switch acreage toward less fertilizer-intensive crops (from corn to soybeans, for example), or accept lower yield potential. This results in a lagged transmission to agricultural commodities, where fertilizer prices move first, planting decisions adjust, and grain prices respond as yield risk becomes visible. Despite the recent move in agriculture futures, the move is less pronounced than energy, as Ag markets tend to price visible inventory and weather risk faster than input-cost-driven yield risk.
Commodity “Super-Cycle” and “Lost Decade” Defined First Two Decades of 21st Century
Source: LPL Research, Bloomberg, 05/20/26
Disclosures: All indexes are unmanaged and cannot be invested in directly. Past performance is no guarantee of future results.
Commodity Markets Recover in the 2020s (April 2020–May 20, 2026)
Source: LPL Research, Bloomberg, 05/20/26
Disclosures: All indexes are unmanaged and cannot be invested in directly. Past performance is no guarantee of future results
The Agribusiness Industry: The Business of Agriculture
Companies participating across the value chain of agricultural production are collectively members of the agribusiness industry, and the industry’s publicly traded shares are known as agribusiness equities. This group of companies participate in a broad range of activities and therefore should not be seen as simple proxies for corn, soybeans, wheat, cattle, or fertilizer prices. These are operating businesses whose economics are tied to commodity cycles through volumes, spreads, farmer income, asset utilization, working capital, and capital allocation. For simplicity, we provide a high-level segmentation of the industry, namely commodity producers, enablers, and spread businesses.
- Commodity producers have the most intuitive commodity exposure. A farmland owner, specialty crop grower, cattle producer, or egg producer is closer to the physical commodity. Examples of producers include Fresh Del Monte Produce (produce grower /distributor) and Cal-Maine Foods (egg producer).
- Commodity enablers sell the tools farmers need to produce crops, such as capital equipment (tractors, combines, and other machinery), seed, chemicals, fertilizer, irrigation, and agronomy services. These companies generally benefit when farmer economics are strong, but they are one step removed from the commodity. Examples of enablers include Deere (farm equipment manufacturing) and Corteva (seed and crop-protection).
- Commodity spread businesses are the least intuitive but often the most important part of public agribusiness. They are grain merchants and processors and may benefit from higher volatility, strong export flows, basis dislocations (a divergence between cash prices and futures), even if crop prices themselves are flat or falling. Thus, equities of spread businesses can behave very differently from agricultural commodity futures. Examples of spread businesses include Archer-Daniels-Midland and Bunge Global.
An important point for investors to keep in mind when analyzing the differences between agricultural commodities and agribusiness equities is that while the equities are exposed to commodity prices and cycles in various ways, they ultimately create (or destroy) shareholder value based on how well they run their respective businesses. Businesses make countless decisions that drive value creation that a bushel of wheat, for example, will never have to make. Said another way, buying commodities is generally a direct expression of supply/demand dynamics in the underlying commodities, while buying agribusiness equities is a call on how companies convert those commodity conditions into earnings and cash flow. This nuance presents itself clearly when analyzing the performance of each asset class over long periods of time.
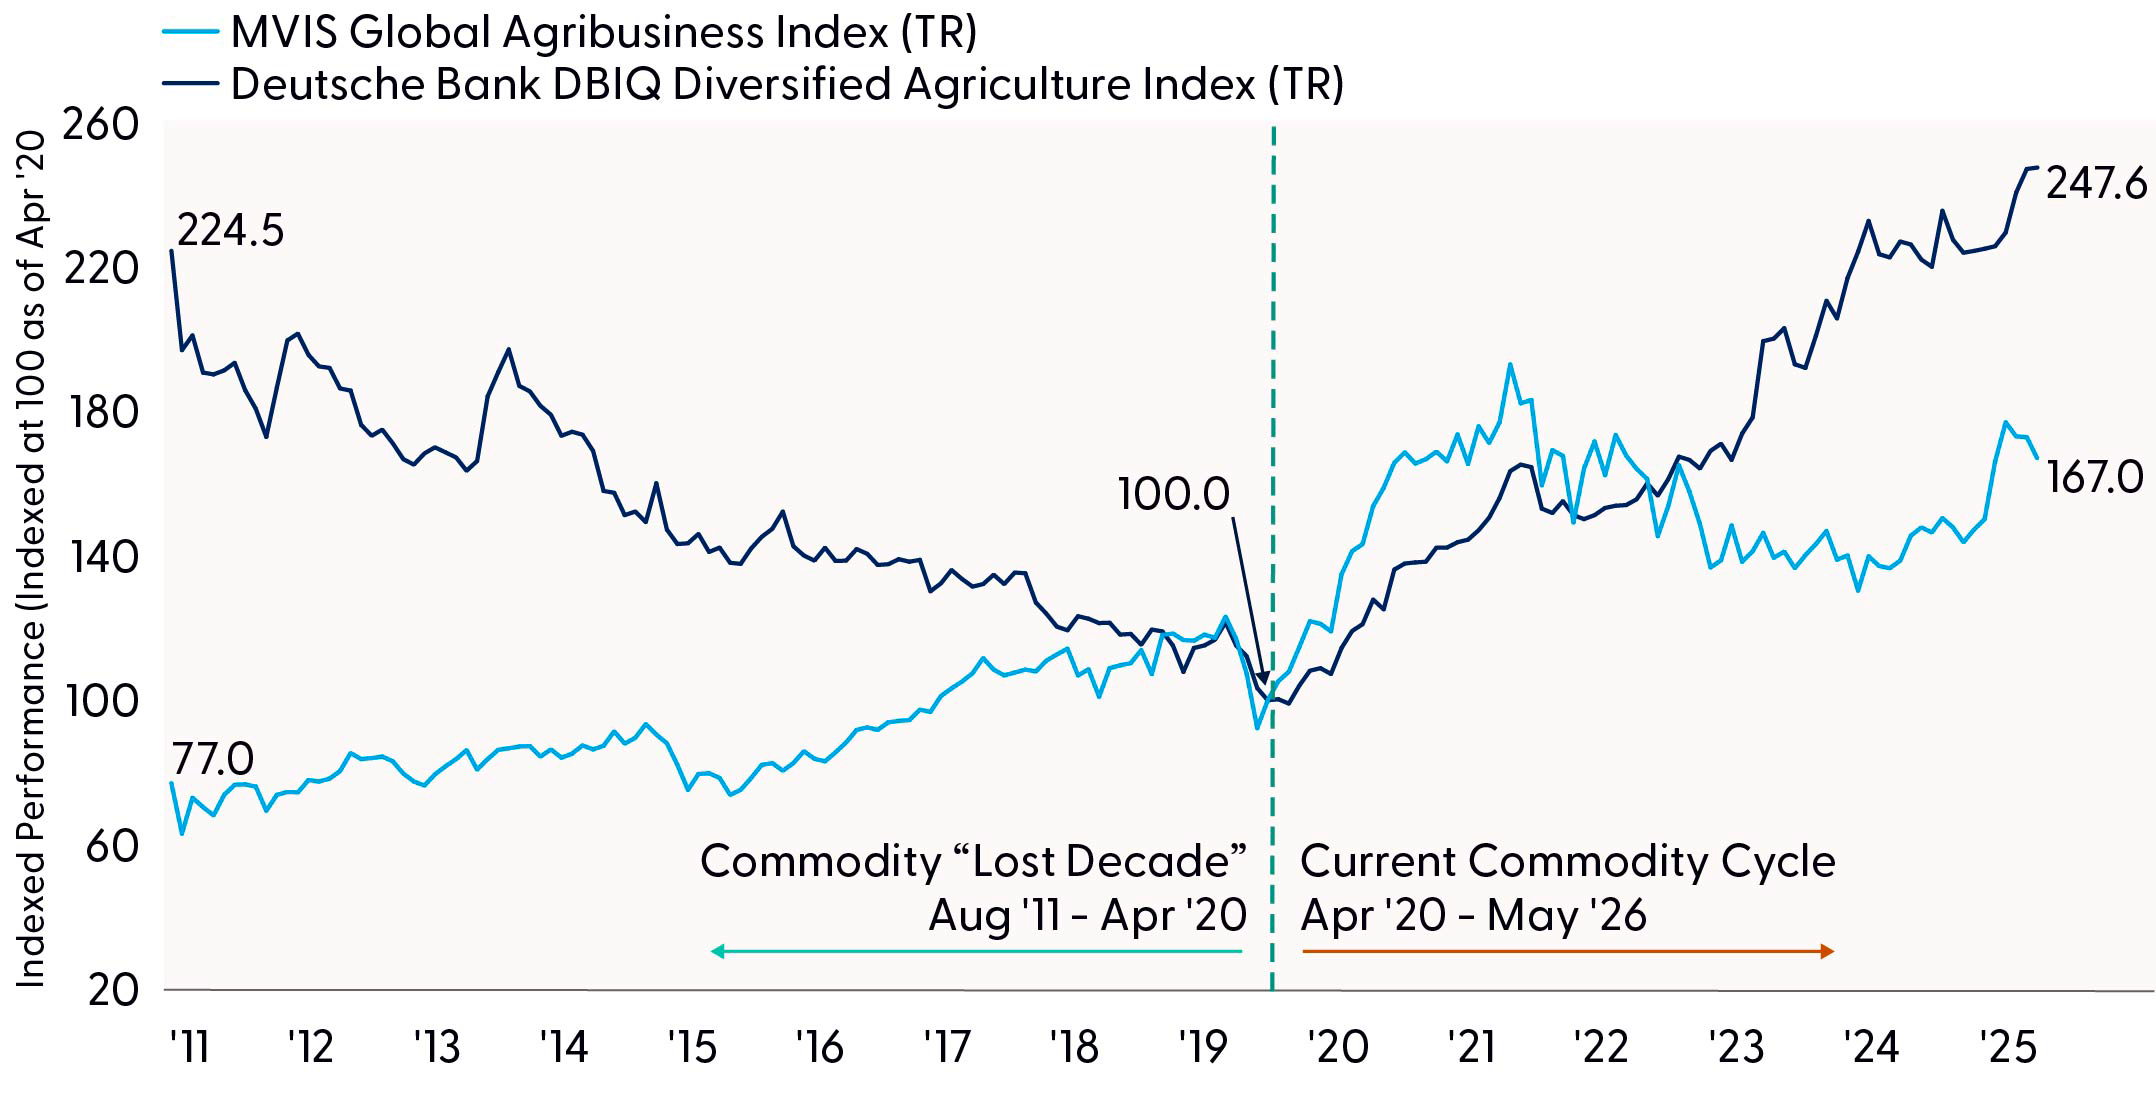
In the “Agribusiness Equities Outperformed Agriculture Commodities in "Lost Decade"; Have Lagged in Current Cycle” chart, we plot indexed monthly cumulative performance of the equities (represented by the MVIS Global Agribusiness Index) against the commodities (represented by the Deutsche Bank DBIQ Diversified Agriculture Index). The chart indexes the performance series at 100 as of April 30, 2020, which is the point in time we designate as the end of the “Lost Decade” cycle and start of the current cycle. In the “Lost Decade” period, equities proved more resilient, producing slightly positive cumulative returns of ~30%. In the last six years, agricultural commodities have outperformed agribusiness equities. Combining these two periods demonstrates the power of compounding, and the struggle of digging out of a drawdown; despite the underperformance during the current cycle, over the entire timeseries the equity index has outperformed the commodity index by over 100%.
Agribusiness Equities Outperformed Agriculture Commodities in "Lost Decade"; Have Lagged in Current Cycle
Source: LPL Research, Bloomberg 05/20/26
Disclosures: Past performance is no guarantee of future results. Estimates may not materialize as predicted and are subject to change
Commodities and Stocks: Convergence and Divergence
How similar should investors expect equities to perform relative to the underlying commodities the businesses are exposed to? The key point to remember is agribusiness equities and agricultural commodities can converge when the market is repricing scarcity, but they often diverge when the question shifts from commodity price direction to how individual companies convert the agricultural cycle into earnings and free cash flow.
The relationship between agribusiness equities and agricultural commodities has been regime dependent. During the latter years of the last commodity “super-cycle” (2007-2012), the two asset’s returns displayed above average correlations (correlation coefficient is a statistical measure of how similarly two data series move), particularly during the 2007–2008 commodity surge, and the 2010–2012 food-price rally and U.S. drought. A similar backdrop has unfolded in the current decade, with the post-COVID-19 and Russia/Ukraine war driven supply shocks again driving above-average correlations. These periods of higher correlations can be explained by rising agricultural prices improving the revenue and earnings backdrop for agribusiness companies. Said differently: the commodity signal was large enough to overwhelm business-model differences.
In between those two periods, which took place primarily during the commodity “Lost Decade,” the relationship was much looser. The 2013–2019 period showed oscillating, unstable correlations as agricultural commodities were pressured by strong supply growth, large harvests, a stronger U.S. dollar, and weaker emerging-market demand, while agribusiness equities were increasingly driven by corporate variables such as equipment replacement cycles, seed and chemical pricing, processing margins, mergers & acquisitions (M&A), and broader equity-market beta.
Note: This correlation analysis was initially published in the May 2026 issue of Beyond the Numbers, and includes additional insights and visual support.
Carrying this analysis forward to today, one could reasonably expect to see the correlation between agriculture commodities and agribusiness equities remain elevated, as the market prices supply uncertainty, with a bias toward scarcity as opposed to abundance as geopolitical driven supply disruptions are likely to continue in an increasingly multi-polar world. However, we remind investors that equities will discount cash flows far into the future, while in the short-term agricultural commodities will tend to move on variables like visible inventory and weather risk. Therefore, we expect equity performance to diverge from commodities for brief periods within a given regime.
Conclusion and Asset Allocation Insights
Agriculture has spent much of the 2020s outside the spotlight occupied by energy and precious metals, but that may be changing. The combination of geopolitical disruption, fertilizer supply risk, a potentially weaker U.S. dollar, and renewed concerns around global food supply creates a more constructive backdrop for agricultural commodities. While the transmission from fertilizer constraints to crop prices can be lagged, the market appears to be moving from an environment defined by abundance toward one increasingly shaped by scarcity risk.
For investors, the opportunity set is broader than simply buying agricultural futures. We believe commodities offer the cleanest exposure to supply and demand, inflation sensitivity, and near-term price risk, while agribusiness equities offer exposure to operating leverage, margins, capital allocation, dividends, and business-model execution. History shows these two asset classes can converge during commodity shocks but diverge when corporate fundamentals matter more than the direction of crop prices, though past performance does not guarantee future results. As a result, investors should view agricultural commodities and agribusiness equities as complementary tools for expressing a view on the agriculture cycle.
Investors seeking focused equity exposure to agricultural commodities should look toward selected individual companies in the agribusiness industry, which primarily reside within the materials, industrials, and consumer staples sectors. The LPL Research Strategic and Tactical Asset Allocation Committee (STAAC) holds a positive outlook on the industrials sector, and a neutral outlook for both the materials and consumer staples sectors. Investors can also seek dedicated exposure to the agribusiness industry via thematic allocation strategies. The STAAC maintains a neutral view on Agriculture (Ag) & Livestock commodities and acknowledges the technical backdrop of the space is improving.
Thomas Shipp, CFA, Head of Equity Research, LPL Financial
Important Disclosures
This material is for general information only and is not intended to provide specific advice or recommendations for any individual. There is no assurance that the views or strategies discussed are suitable for all investors or will yield positive outcomes. Investing involves risks including possible loss of principal. Any economic forecasts set forth may not develop as predicted and are subject to change.
References to markets, asset classes, and sectors are generally regarding the corresponding market index. Indexes are unmanaged statistical composites and cannot be invested into directly. Index performance is not indicative of the performance of any investment and do not reflect fees, expenses, or sales charges. All performance referenced is historical and is no guarantee of future results.
Any company names noted herein are for educational purposes only and not an indication of trading intent or a solicitation of their products or services. LPL Financial doesn’t provide research on individual equities.
All information is believed to be from reliable sources; however, LPL Financial makes no representation as to its completeness or accuracy.
All investing involves risk, including possible loss of principal.
US Treasuries may be considered “safe haven” investments but do carry some degree of risk including interest rate, credit, and market risk. Bonds are subject to market and interest rate risk if sold prior to maturity. Bond values will decline as interest rates rise and bonds are subject to availability and change in price.
The Standard & Poor’s 500 Index (S&P500) is a capitalization-weighted index of 500 stocks designed to measure performance of the broad domestic economy through changes in the aggregate market value of 500 stocks representing all major industries.
The Bloomberg Commodity Index (BCOM) is made up of 24 exchange-traded futures on physical commodities, representing 22 commodities which are weighted to account for economic significance and market liquidity.
The Deutsche Bank DBIQ Diversified Agricultural Index is intended to reflect the economic performance of investing in Agriculture futures. This is achieved by creating exposure to the performance of the Single Commodity Indices within the Agriculture sector which in turn reference commodity futures contract in respect of the relevant commodities within the sector.
The MVIS® Global Agribusiness Index (MVMOO) tracks the performance of the largest and most liquid companies in the global agribusiness segment.
All index data from FactSet or Bloomberg.
This research material has been prepared by LPL Financial LLC.
Not Insured by FDIC/NCUA or Any Other Government Agency | Not Bank/Credit Union Guaranteed | Not Bank/Credit Union Deposits or Obligations | May Lose Value
MC-0007019-0426 Tracking #1113960 | #1113962 (Exp. 05/2027)